




















All Integrations

Unlock SnapLogic Performance Optimization with RapDev’s Integration

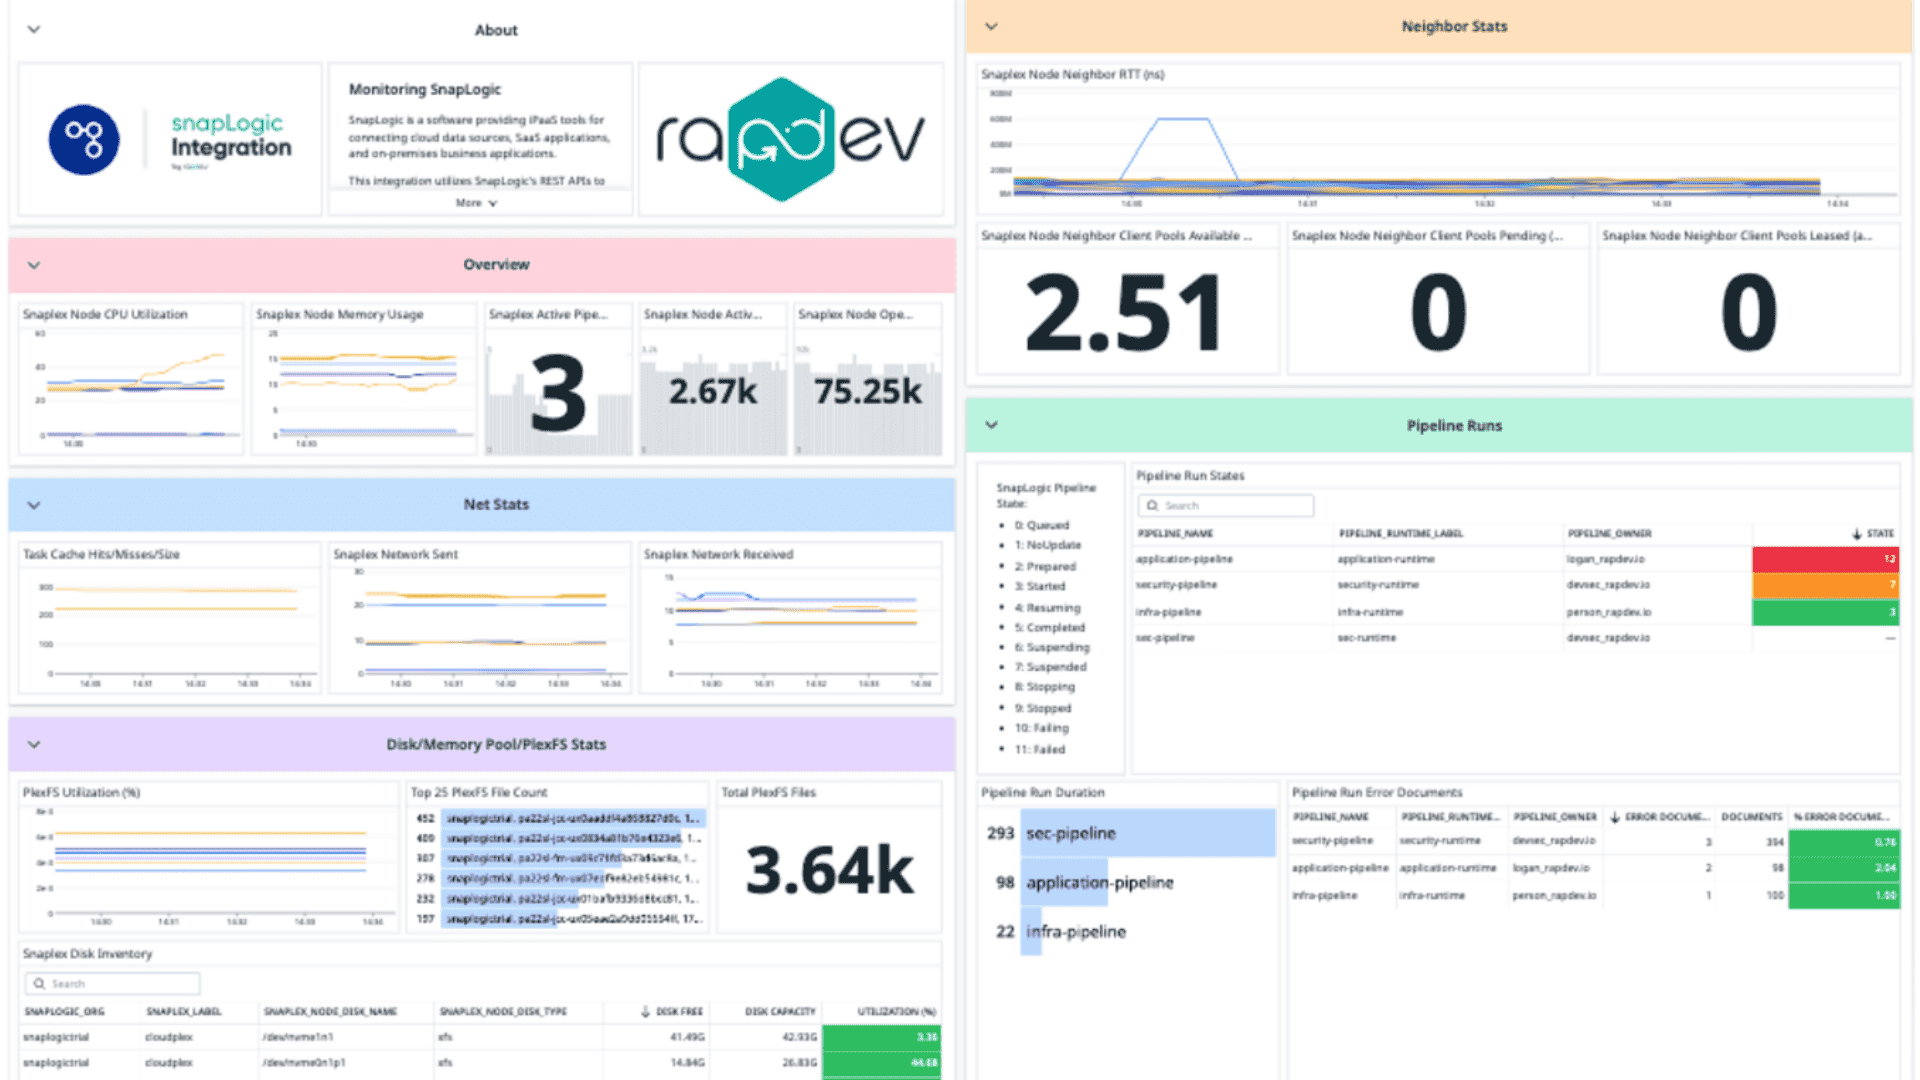
Gain full visibility into your SnapLogic platform with an intuitive dashboard to monitor node performance, pipeline execution, network activity, and storage utilization, optimizing data integration.

Key Highlights

Key Metrics for SnapLogic Performance 

Track critical metrics like CPU and memory usage, active threads, file descriptors, and more.

Monitor network performance, pipeline execution, and storage utilization to optimize resources and improve the efficiency of your SnapLogic platform.


Watch a Demo

SnapLogic Integration by RapDev

Watch a short demo of RapDev's SnapLogic Integration for the Datadog Marketplace. See how you can gain comprehensive insights into your SnapLogic platform with this single dashboard providing key metrics such as node CPU utilization, open file descriptors, and node memory usage.

Datadog demos

Download Our Integration

Sign up for a 14 day free trial and receive:

  • Unlimited access to our Enterprise configuration
  • Comprehensive visibility into key SnapLogic performance metrics
  • Pre-built dashboards for quick implementation
  • Free consultation call to discuss best use cases
Start my free trial